Related topic: This article is part of Biological Age Testing and Tracking. If you want the broader overview, start with Best Biological Age Test Guide: How Biological Age Tests Work And Compare. If you’re serious about extending your healthspan, you need data. Not guesses, not assumptions—actual measurements that track what matters inside your body.
This guide is for health-conscious adults aged 30-60 who are pursuing proactive, preventive approaches to medicine. Whether you’re optimizing for performance or simply want to age well, understanding your body composition, bone health, and metabolic rate gives you the foundation to make informed decisions.
A dexa scan supports longevity goals by detecting sarcopenia, osteopenia, and visceral adiposity years before they become clinical problems. These aren’t just numbers on a report—they’re independent predictors of all-cause mortality. By tracking these metrics over time, you can intervene early and measure whether your interventions actually work.
Overview of DEXA Scan Use for Longevity
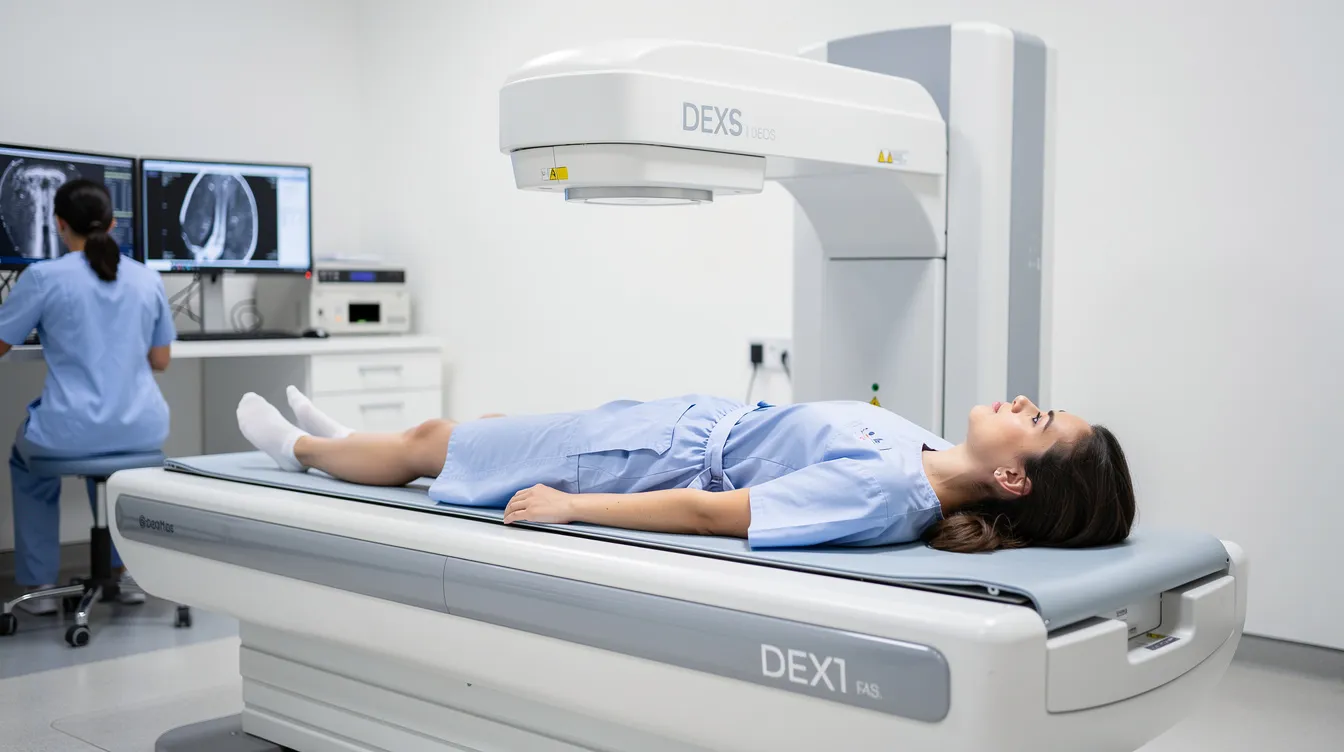
A dexa scan, or dual x ray absorptiometry, uses two low-energy X-ray beams to precisely measure bone, fat, and lean tissue throughout your body.
Frame dexa scans as tools for preventive longevity care rather than reactive medicine. Traditional guidelines recommend bone scans at age 65 for women and 70 for men—far too late to establish baselines or catch early decline. Longevity-focused protocols shift this timeline earlier, treating the scan as a monitoring tool rather than a diagnostic afterthought.
A full-body scan delivers three categories of outputs:
- Body composition measurements: Regional breakdown of fat mass, lean mass, and bone across your entire body
- Bone mineral density: T scores and Z scores for lumbar spine, hip, and other skeletal sites
- Metabolic estimates: Resting metabolic rate derived from your fat-free mass
DEXA scans provide valuable insight into metabolism by estimating your resting metabolic rate and helping you understand how fat metabolism and muscle mass impact overall health and longevity.
This comprehensive picture reveals imbalances invisible to scales or BMI calculations.
What DEXA Scans Measure: Body Composition
Body composition refers to the proportional distribution of fat, lean mass (muscle, organs, water), and bone mineral content in your body. Two people with identical weight can have dramatically different compositions—one with high visceral fat and low muscle predisposing to metabolic syndrome, the other with balanced lean mass supporting insulin sensitivity. Subcutaneous fat is stored beneath the skin, while visceral fat is stored deeper in the abdominal cavity; DEXA scans can distinguish between these fat types to better assess health risks.
Full-body scans provide color-coded regional images and tricompartment breakdowns. Bone-only scans restrict analysis to the axial skeleton (spine and hip) and omit soft-tissue composition entirely. For longevity purposes, comprehensive scans capture both sarcopenia and osteoporosis risks simultaneously.
Bone Mineral Density (BMD) And T Scores
Bone mineral density, measured in g/cm², quantifies the mineral content of your bones per unit area. This is the primary diagnostic for skeletal fragility and fracture risk.
T scores compare your bone density to a young adult reference population. A T-score of -1.0 or above is considered within the normal range, indicating healthy bone density and lower fracture risk:
| T Score Range | Classification |
|---|---|
| ≥ -1.0 | Normal |
| -1.0 to -2.5 | Osteopenia |
| ≤ -2.5 | Osteoporosis |
Each 1 standard deviation decrease in BMD approximately doubles your hip fracture risk.
Lumbar spine (L1-L4 average) and hip (femoral neck/total) values should be reported separately. The spine reflects trabecular bone that’s sensitive to hormonal changes, while the hip contains more cortical bone—stable but fracture-prone. Low bone density at either site warrants different intervention strategies.
The z score provides an age-matched comparison. A z score below -2.0 in younger adults signals potential secondary causes like thyroid dysfunction requiring further investigation.
Muscle Mass: Lean Mass, ALMI, And Sarcopenia
Muscle mass metrics from DEXA include total lean mass, appendicular lean mass (ALM—the sum of arm and leg lean tissue), and ALMI (ALM divided by height squared, in kg/m²).
ALMI cutoffs for sarcopenia diagnosis:
| Classification | Men | Women |
|---|---|---|
| Probable sarcopenia | < 7.0 kg/m² | < 5.5 kg/m² |
| Severe sarcopenia | < 5.7 kg/m² | < 4.3 kg/m² |
Muscle loss begins around age 30, declining 3-8% annually and accelerating after 60. Sarcopenia independently raises mortality risk 2-3x through falls, frailty, and impaired physical function.
Track muscle mass trends over time rather than fixating on single measurements. DEXA’s reproducibility of ±1-2% allows detecting 1-2 kg gains from interventions within 6 months. This makes it possible to confirm whether your strength training and diet are producing real change.
Fat Mass: Total Fat And Visceral Fat
Fat mass encompasses both total body fat percentage and visceral adipose tissue (VAT)—the metabolically active fat stored in your abdominal cavity around organs.
Optimal total body fat ranges for longevity typically fall between 10-20% for men and 18-28% for women. But total fat matters less than how much fat sits in the visceral compartment.
Medical VAT thresholds:
| Visceral Fat Area | Risk Level |
|---|---|
| < 100 cm² | Low |
| 100-130 cm² | Moderate |
| > 130 cm² (men) / > 100 cm² (women) | High |
Visceral fat area above these thresholds is associated with an increased risk of metabolic syndrome, cardiovascular disease, and type 2 diabetes—correlating with 2-4x elevated cardiometabolic disease risk. Unlike subcutaneous fat (which may even be protective at moderate levels), visceral fat drives inflammation and insulin resistance.
Plot your VAT against age and sex percentiles. Being above the 75th percentile signals the need for intervention, regardless of your total body weight.
Resting Metabolic Rate And Metabolic Rate Estimates
DEXA estimates resting metabolic rate using regression equations based on your fat-free mass. A common formula: RMR = 370 + 21.6 × FFM (kg).
Typical RMR values range from 1,600-2,000 kcal/day for average adults. To convert RMR into daily calorie recommendations, multiply by an activity factor:
- Sedentary: 1.2
- Light activity: 1.4
- Moderate activity: 1.6
- Very active: 1.9
This gives you a measured baseline for caloric intake rather than generic calculator estimates. The accuracy is within 10-15% of indirect calorimetry—close enough for practical fat burning and nutrition planning.
Re-measure RMR after significant body composition changes. Gaining muscle boosts metabolic rate by approximately 50-100 kcal per kilogram of new tissue, which changes your caloric requirements.
Interpreting Results: T Scores, Percentiles, And Risk Factors
T scores benchmark you against young adult peak bone mass—useful for osteoporosis diagnosis. Z scores benchmark against age, sex, and ethnicity-matched peers—useful for identifying outliers who warrant further investigation.
Percentile rankings contextualize your results. A BMD at the 50th percentile for a 45-year-old Caucasian female means half the reference population has higher density, half lower. These rankings help track whether you’re ahead or behind your peers.
Osteoporosis risk factors:
- Postmenopausal status (estrogen loss accelerates bone loss ~2%/year)
- Glucocorticoid use (8-12% annual loss)
- Low BMI (< 20 kg/m²)
- Family history of fractures
- Alcohol intake > 3 units/day
- Smoking (OR 1.5-2)
- Vitamin D deficiency (< 20 ng/mL)
Sarcopenia risk factors:
- Age > 65 (prevalence 10-50%)
- Physical inactivity
- Protein intake < 1.0 g/kg/day
- Chronic illness (COPD doubles risk)
- Testosterone decline in men
Visceral fat risk factors:
- Insulin resistance
- Hypertension
- Dyslipidemia
- Sleep apnea
- Polycystic ovary syndrome in women
The FRAX tool estimates 10-year major osteoporotic fracture probability by combining BMD with clinical risk factors—useful for patients with borderline t scores.
DEXA, Metabolic Health, And Brain Aging
Visceral fat drives metabolic syndrome through adipokine dysregulation, including elevated IL-6 and suppressed adiponectin. The consequences cascade: visceral fat area above 130 cm² triples type 2 diabetes risk, elevates cardiovascular disease risk 1.5-3x, and promotes fatty liver disease and atherosclerosis.
Low muscle mass impairs glucose regulation independently. Sarcopenic obesity—the combination of low lean mass and high fat—raises diabetes odds 3-fold through reduced GLUT4 glucose transporters in muscle cells.
Evidence links poor metabolic health to brain aging. Midlife visceral adiposity associates with 10-15% higher dementia risk via vascular damage and chronic inflammation. Low appendicular lean mass correlates with cognitive decline (HR 1.4 per standard deviation decrease) through frailty and hypoglycemic episodes. Studies like the Health ABC cohort confirm body composition predicts neurodegeneration independently of APOE genetic status.
For patients with VAT > 130 cm² or ALMI below sarcopenia thresholds, consider integrating cognitive screening tools like the MoCA to detect early impairment alongside metabolic disease risk.
Clinical Recommendations: Who, When, And How Often To Scan
Baseline timing: A baseline dexa scan around age 30 establishes longevity monitoring while you’re still near peak bone accrual. Waiting until 65 (per preventive services task force guidelines) misses decades of actionable data points.
Body composition frequency: Scan every 6-12 months during active interventions like training programs or cancer treatment support. This timeline allows detecting meaningful changes while adjusting protocols.
Bone mineral density frequency:
- Osteopenia: every 1-2 years
- Normal/stable: every 2-5 years
- Post-intervention: 1-2 years to assess response
In many clinical settings, a medical director oversees DEXA scan protocols and ensures accurate interpretation of results, lending additional expertise to patient care.
High-risk groups needing earlier or more frequent scans:
- Family history of osteoporosis or bone fractures
- Early menopause (before age 45)
- Low trauma fracture history
- Vegans (B12 and vitamin D deficit risk)
- Patients on GLP-1 agonists (1-2% muscle loss risk)
- Athletes monitoring for relative energy deficiency
Actionable Interventions To Improve Longevity Metrics
Progressive resistance training for muscle mass: 3-4 sessions weekly at 70-85% of 1RM for 8-12 reps yields 1-2 kg ALM gains in 3-6 months. Focus on compound movements that challenge major muscle groups.
Protein targets: 1.6-2.2 g protein per kilogram of lean body weight optimizes muscle protein synthesis. For a 70 kg person, this means 120-160g daily, distributed across meals. Patients over 50 particularly benefit from higher protein intake.
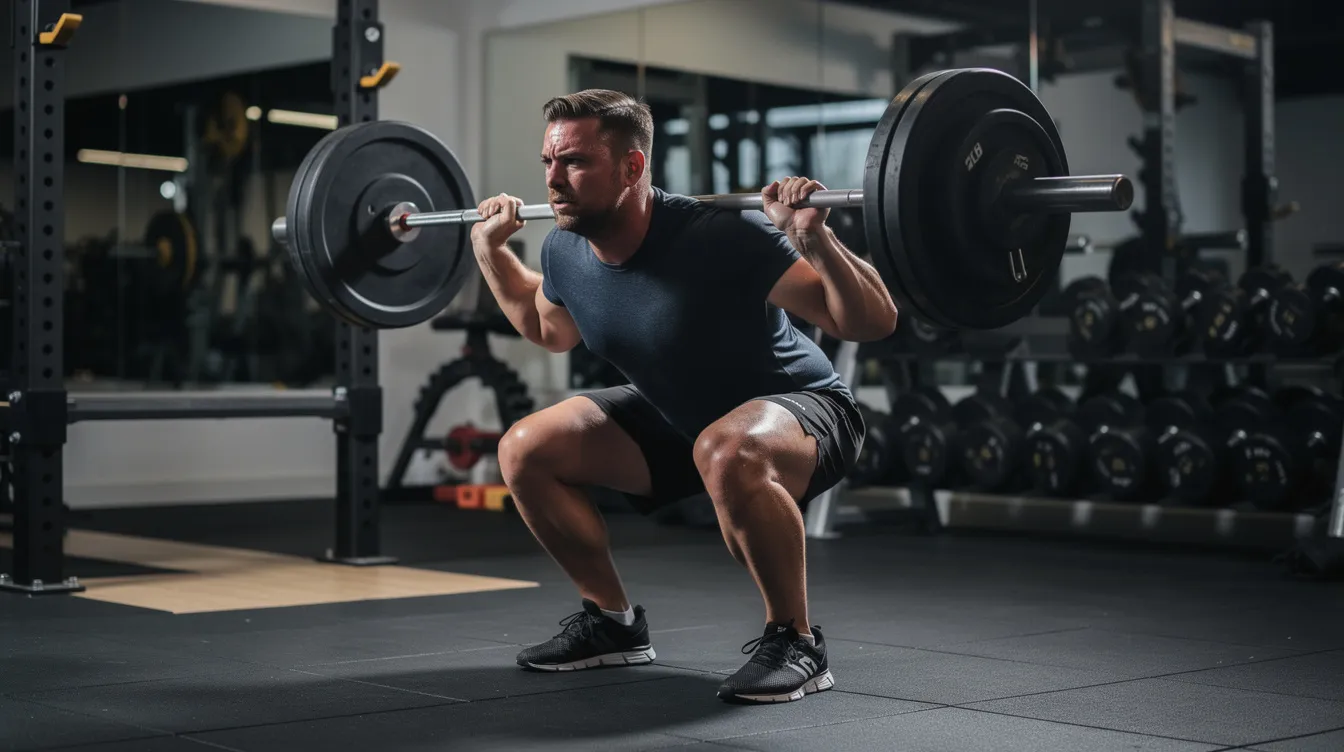
Heavy load-bearing exercise for bone health: Squats, deadlifts, and weighted carries at >80% 1RM improve bone mineral density 1-3% annually through mechanotransduction. Impact activities like jumping also stimulate bone remodeling.
Vitamin D and calcium optimization: 1,000-2,000 IU vitamin D daily plus 1,200 mg calcium targets serum 25-OH-D of 30-50 ng/mL. Test and adjust based on measured levels rather than supplementing blindly.
Caloric strategy based on measured RMR: Set intake at RMR × 1.4-1.6 for body recomposition. Avoid crash diets that accelerate muscle loss—sustainable fat distribution changes require moderate deficits.
Visceral fat reduction: High-intensity interval training combined with 30g daily fiber safely drops VAT 10-20% in 12 weeks. Address sleep and stress, which independently affect visceral fat accumulation in the abdomen and liver.
Follow-up scans: Plan DEXA scans 6-12 months post-intervention to validate 5-10% metric shifts and adjust protocols based on measured outcomes rather than assumptions.
Reporting, Tools, And Practical Considerations
A sample DEXA report includes:
- Demographics and scan date
- Full-body composition image
- Tricompartment breakdown (e.g., fat 22%, lean 72%, bone 6%)
- Regional VAT (e.g., 120 cm², 75th percentile)
- ALMI (e.g., 8.2 kg/m²)
- Spine and hip BMD with t scores
- Estimated RMR
- FRAX fracture risk percentage
Comparison of body composition methods:
| Method | Accuracy | Radiation | Cost | Best For |
|---|---|---|---|---|
| DEXA | ±1-2% body fat | Minimal (0.001-0.03 mSv) | Moderate | Comprehensive monitoring |
| CT | Gold standard VAT | High (10x DEXA) | High | Research/clinical |
| MRI | Excellent | None | Very high | Research |
| BIA | ±3-5% body fat | None | Low | Screening |
DEXA radiation exposure equals 1-2 days of background radiation—safe for annual use. Select ISCD-certified providers to minimize inter-machine variability below 2%.
Limitations, Uncertainties, And Next Steps
Measurement variability: Expect 1-3% precision errors from technician calibration, patient positioning, or machine differences between facilities. Use the same machine for longitudinal tracking when possible.
Reference database limitations: Ethnicity-specific databases may underrepresent Asian and African populations, affecting percentile accuracy for these groups.
No direct brain measurement: DEXA cannot directly assess brain aging or cognitive function. Peripheral metrics serve as proxies for neurodegeneration risk but require separate cognitive testing for confirmation.
Future research directions: Artificial intelligence-enhanced DEXA analysis shows promise for predicting frailty scores and mortality risk from scan data. Longitudinal models may eventually predict 5-10 year outcomes using deep learning on composition trends.
Patient communication for abnormal results: “Your visceral fat at 150 cm² (90th percentile) elevates your metabolic risks. I recommend starting progressive resistance training and reviewing your diet, with a follow-up scan in 6 months to track changes.”
DEXA scans provide the data points you need to achieve your longevity goals. Rather than guessing whether your training, diet, or interventions are working, you get accurate measurements that show real change over time.
Start with a baseline scan to establish your current body composition, bone density, and metabolic rate. Work with a qualified provider to interpret results in context. Then implement targeted interventions—and rescan to confirm they’re actually moving the needle.
Your longevity strategy deserves better than guesswork.