Related topic: This article is part of Biological Age Testing and Tracking. If you want the broader overview, start with Best Biological Age Test Guide: How Biological Age Tests Work And Compare. Your birth certificate tells one story about your age. Your cells tell another.
Over the past decade, scientists have developed sophisticated tools called epigenetic clocks that estimate biological aging by analyzing chemical patterns on your DNA. Epigenetic clocks are an aging clock based on molecular markers such as DNA methylation, providing a mechanistic approach to estimating biological age. These molecular timekeepers have revolutionized aging research, revealing that two people born on the same day can have dramatically different biological ages at the cellular level.
This guide breaks down how epigenetic clocks work, what dna methylation tells us about the aging process, and why these tools matter for predicting health outcomes. Whether you’re a health enthusiast curious about longevity science, a clinician exploring new biomarkers, or a researcher seeking an accessible overview, you’ll find practical insights here.
What you will learn:
- How dna methylation creates a readable record of biological time
- The critical difference between chronological age and epigenetic age
- Methods researchers use to build and validate aging clocks
- Connections between dna methylation age and chronic diseases
- Why the cerebellum ages slowly compared to other brain regions
- Lifestyle factors that influence epigenetic aging rates
- Future directions in pan-mammalian and multi-omic research
Overview Of DNA Methylation And Epigenetic Clocks
Before diving into the mechanics of biological aging measurement, you need to understand two foundational concepts: what dna methylation actually is, and how scientists transformed this molecular process into a clock.
Epigenetic clocks are a type of dna methylation based biomarkers used to estimate biological age and healthspan.
Define DNA Methylation For Readers
DNA methylation involves the addition of a small chemical tag—a methyl group (CH3)—to specific locations on your DNA. This modification typically occurs at CpG sites, where a cytosine nucleotide sits directly next to a guanine nucleotide in the genetic sequence.
Think of cytosine methylation as a dimmer switch for genes. When methyl groups accumulate near a gene’s promoter region, they typically silence that gene by:
- Recruiting proteins that compact the surrounding chromatin structure
- Blocking the cellular machinery needed to read and express the gene
- Maintaining cell identity by keeping inappropriate genes turned off
Methylation changes near transcriptional start sites are particularly significant for gene regulation and have been associated with aging processes.
This process explains why a heart cell behaves differently from a skin cell despite containing identical DNA. The methylation patterns differ, keeping cardiac genes active in heart tissue while silencing them elsewhere.
Three key enzyme families control this system:
| Enzyme Type | Function |
|---|---|
| DNMT1 | Maintains methylation patterns during DNA replication |
| DNMT3A/DNMT3B | Establishes new methylation marks (de novo) |
| TET enzymes | Removes methylation through oxidation to 5-hydroxymethylcytosine |
Far from static, dna methylation levels fluctuate dynamically. Research on stem cells shows methylation at enhancer regions can oscillate every 2-3 hours, independent of DNA replication. This dynamic nature makes methylation both a regulator of gene expression and a recorder of cellular history.
Explain Concept Of An Epigenetic Clock
An epigenetic clock is a mathematical model that estimates biological age by analyzing methylation levels across specific CpG sites throughout the genome.
The concept crystallized in 2013 with two landmark publications. Steve Horvath developed a pan-tissue clock using 353 CpG sites that predicted age across 51 different tissues with a median error of approximately 3.6 years. Gregory Hannum et al simultaneously published a blood-based clock with similar accuracy.
These dna methylation clocks work through machine learning algorithms—typically elastic net regression—trained on large datasets where researchers know both the methylation patterns and chronological ages of thousands of samples. The algorithm identifies which CpG sites change most predictably with age and assigns each site a coefficient weight.
The output is a single number: dna methylation age (often abbreviated DNAm age). This represents your biological age as estimated from your methylation landscape.
Key characteristics of epigenetic clocks include:
- Genome-wide sampling: Modern clocks analyze hundreds to thousands of CpG sites
- Tissue flexibility: Pan-tissue clocks work across multiple sample types
- Age correlation: DNA methylation age is highly correlated with chronological age across diverse populations, with the best clocks achieving correlations above r = 0.96
- Predictive power: DNAm age outperforms other biomarkers like telomere length for health outcome prediction
The clock “ticks” because age related methylation changes follow predictable patterns. CpGs that start at extreme values (near 0% or 100% methylated) tend to drift toward intermediate levels around 50% over the lifespan, reflecting what researchers call entropic decay in the methylation landscape.
Chronological Age Versus DNA Methylation Age
Understanding epigenetic clocks requires grasping a fundamental distinction: the calendar and your cells often disagree about how old you are.
Contrast Chronological Age With DNA Methylation Age
Chronological age counts years since birth. It’s fixed, external, and identical for everyone born on the same date.
DNA methylation age derives from regression models fitting methylation beta-values (ranging 0-1, representing unmethylated to fully methylated fractions) to training cohort ages. While these predictions can be remarkably accurate—with correlations exceeding r = 0.96 in blood samples—they diverge systematically from calendar age in meaningful ways.
| Metric | Chronological Age | DNA Methylation Age |
|---|---|---|
| Source | Birth certificate | Methylation array data |
| Variability | None between individuals | Varies by tissue, lifestyle, genetics |
| Health prediction | Limited | Strong mortality risk correlation |
| Modifiability | Impossible | Potentially modifiable through interventions |
The relationship between these two measures isn’t perfectly linear across the lifespan. Clocks tend to underestimate true age in older subjects, possibly due to accumulated dna damage that introduces persistent epigenetic alterations following repair attempts. Each cell experiences approximately 50 double-strand breaks per cell cycle and 10,000 daily oxidative lesions, creating opportunities for epigenetic marks to be altered during repair processes.
Define Age-Related Methylation Changes
Age related methylation changes encompass both increases (hypermethylation) and decreases (hypomethylation) at specific genomic locations:
Hypermethylation patterns:
- Accumulates at CpG islands near gene promoters
- Concentrates at Polycomb repressive complex 2 targets
- Correlates with silencing of developmental genes
- Average changes of 3.2% per CpG between under-35s and over-55s in Horvath’s clock
Hypomethylation patterns:
- Occurs at enhancers of highly expressed genes
- Ties to transcriptional hyperactivity
- Contributes to genomic instability
Some CpG sites show dramatic shifts. The ELOVL2 gene contains a CpG that spans from 7% to 91% methylation across the human lifespan—a hallmark hypomethylator frequently used in forensic age estimation.
The genome-wide trend involves thousands of potential clock-like CpG sites, with approximately 70,000 candidates identified in blood alone. These sites distribute throughout the genome rather than clustering in specific regions.
Introduce Age Acceleration As A Metric
Age acceleration quantifies the gap between your biological and chronological ages. It’s calculated as the residual from a regression model:
Age Acceleration = DNAm Age − Chronological Age
A positive value indicates faster biological aging. If your DNAm age reads 55 but you’re chronologically 50, you have 5 years of epigenetic age acceleration—your tissues appear older than expected.
Negative values suggest slower aging, with tissues appearing younger than calendar time would predict. This metric serves as the primary outcome in most epigenetic clock research because it captures inter-individual variation in aging rates.
Age acceleration matters clinically because it:
- Associates with all-cause mortality risk even after adjusting for traditional risk factors
- Predicts reduced physical and mental fitness
- Precedes disease onset in prospective studies
- Shows modest heritability (20-40%), indicating both genetic and environmental contributions
Researchers often distinguish between intrinsic and extrinsic age acceleration. Intrinsic epigenetic age acceleration (IEAA) adjusts for immune cell composition, isolating age effects independent of shifting blood cell proportions. Extrinsic acceleration includes immune system changes, capturing additional aging-related information.
Methods To Estimate DNA Methylation Age
Building an epigenetic clock requires specialized laboratory techniques and computational approaches. Understanding these methods helps interpret clock results and their limitations.
Describe Array And Sequencing Measurement Options
Two primary technologies generate dna methylation data for clock analysis:
Illumina Infinium Methylation Arrays
The workhorse of epigenetic clock research, these arrays measure methylation at predefined CpG positions using bisulfite conversion chemistry. Unmethylated cytosines convert to uracil during bisulfite treatment, while methylated cytosines resist conversion. This difference becomes detectable through hybridization to complementary probes.
Current array specifications:
| Platform | CpG Probes | Cost | Best Use |
|---|---|---|---|
| 450K Array | ~485,000 | Lower | Legacy datasets |
| EPIC Array | ~850,000 | Moderate | Standard research |
| EPICv2 | ~900,000 | Moderate | Enhanced coverage |
Arrays provide cost-effective, highly reproducible beta-values suitable for large cohorts. Most published clocks were trained on array data.
Whole-Genome Bisulfite Sequencing (WGBS)
WGBS offers single-base resolution across all ~28 million CpGs in the human genome. This approach requires greater sequencing depth and costs more per sample but enables discovery of novel clock sites outside array coverage.
WGBS advantages include:
- Complete genome coverage
- Detection of rare or tissue-specific CpG sites
- No probe design biases
The trade-off involves higher per-sample costs and more complex data processing pipelines, making arrays the practical choice for most biomedical research applications.
Outline Model Training Steps For Clock Construction
Building an epigenetic clock follows a systematic machine learning workflow:
Step 1: Data Preprocessing
- Remove probes overlapping known SNPs (genetic variants can confound methylation readings)
- Exclude cross-hybridizing probes that bind multiple genomic locations
- Normalize batch effects between array runs
- Apply correction methods like BMIQ for technical probe-type differences
Step 2: Feature Selection Elastic net regression, combining L1 (LASSO) and L2 (ridge) penalties, identifies the most predictive CpG sites while preventing overfitting. Cross-validation (typically 10-fold) determines optimal regularization parameters by minimizing mean absolute error (MAE).
Step 3: Model Fitting The algorithm assigns coefficient weights to selected CpGs. Final DNAm age equals the weighted sum of methylation beta-values plus an intercept term:
DNAm Age = Intercept + (β₁ × CpG₁) + (β₂ × CpG₂) + ... + (βₙ × CpGₙ)
Step 4: Validation Independent cohorts test model performance using metrics including:
- Pearson correlation (r > 0.90 expected)
- MAE (typically 2.9-3.6 years for well-performing clocks)
- Median absolute percentage error (MedAPE < 5%)
Mention Pan-Mammalian Clock Approaches
Recent advances extend epigenetic clocks beyond humans to enable cross-species aging comparisons. Pan-mammalian clocks identify CpG sites that tick at comparable rates across mammalian species with very different lifespans.
Horvath’s 2022 universal mammalian clock analyzed approximately 71,000 CpGs across 59 species, from mice to elephants. These clocks demonstrate that:
- Core aging mechanisms are evolutionarily conserved
- Inter-species predictions achieve accuracy within 5 years
- Relative biological age (proportion of maximum lifespan) can be compared across species characteristics
This work enables researchers to test anti-aging interventions in shorter-lived model organisms and extrapolate findings to human applications—a significant methodological advance for the field.

Biological Aging, Age-Related Markers, And Health Outcomes
Epigenetic clocks do more than estimate calendar time. They capture aspects of biological aging that predict mortality risk and health span better than chronological age alone.
Link DNA Methylation Age To Biological Aging
DNAm age serves as a proxy for core aging hallmarks, including genomic instability, loss of proteostasis, and cellular senescence. This connection explains why epigenetic age acceleration consistently predicts mortality risk.
Large epidemiological studies demonstrate the predictive power:
- Each year of acceleration associates with 2-4% increased mortality risk
- Accelerated clocks precede death by 4-14 years in prospective cohorts
- Associations persist after adjusting for traditional risk factors like smoking, BMI, and blood pressure
- DNAm age captures inter-individual “epigenetic drift”—divergent methylation patterns from accumulated cellular stresses
Unlike chronological age, which advances identically for everyone, epigenetic aging rates vary substantially between individuals. Twin studies show that even genetically identical individuals can diverge in DNAm age over time, highlighting environmental contributions to the aging process.
List Top Age-Related CpG Loci To Report
Certain CpG sites show particularly strong age correlation and appear across multiple clock models. Key loci for researchers to track:
| CpG ID | Gene | Direction | Notes |
|---|---|---|---|
| cg16867657 | ELOVL2 | Hypomethylation | Spans 7-91% across lifespan |
| cg24724428 | FHL2 | Hypermethylation | Coefficient ~+15.2 in some clocks |
| cg00000029 | NPTX2 | Hypermethylation | ~20% increase over lifespan |
| cg06639320 | PENK | Hypermethylation | Forensic age marker |
These loci represent the strongest signals, but clock accuracy derives from aggregating information across hundreds of sites. No single CpG provides sufficient precision for age estimation alone.
Summarize Genetic Influences On Methylation Aging
Approximately 20-40% of variation in age acceleration appears heritable, based on twin and family studies. Genome wide association studies have identified specific genetic variants influencing epigenetic aging rates.
Key findings from human genetics research:
- Variants near DNMT3A associate with methylation patterns genome-wide
- Cis-methylation quantitative trait loci (mewQTLs) explain substantial local methylation variation
- Multiple loci contribute small individual effects that aggregate into meaningful acceleration
- Gene expression data at relevant loci help interpret mechanistic pathways
The remaining 60-80% of variance reflects environmental factors, stochastic variation, and gene-environment interactions—making lifestyle modification a meaningful lever for influencing biological aging.
Include Common Lifestyle Correlates To Cite
Lifestyle factors show consistent associations with epigenetic age acceleration across studies. The evidence supports both risk factors that accelerate aging and protective behaviors that promote slower aging.
Factors Associated with Faster Epigenetic Aging:
| Factor | Acceleration per Unit | Source Studies |
|---|---|---|
| Smoking | 0.11-1.37 years per pack-year | Multiple meta-analyses |
| BMI | 0.09 years per unit increase | Women’s Health Initiative, others |
| Alcohol | 0.11 years per unit | Cohort studies |
| Chronic stress | Variable | Limited mechanistic data |
Factors Associated with Lower Epigenetic Age:
| Factor | Deceleration | Source Studies |
|---|---|---|
| Vigorous exercise | Up to 0.4 years | Intervention trials |
| Mediterranean diet | 0.8 years | Meta-analyses |
| Higher education | 0.5-1.5 years | Observational cohorts |
| Adequate sleep | Under investigation | Emerging evidence |
C reactive protein and other biomarkers of inflammation correlate with accelerated clocks, suggesting inflammatory pathways may mediate some lifestyle effects. Metabolic syndrome components—elevated glucose levels, dyslipidemia, central obesity—consistently associate with faster aging.
These associations don’t prove causation, but they align with broader evidence that lifestyle modification impacts aging trajectories.
Brain Aging: Cognitive Functioning, Cerebellum Ages Slowly, And Alzheimer’s Disease
Brain tissue presents unique patterns in epigenetic aging, with striking regional variation and important clinical implications for neurodegenerative disease. Epigenetic age acceleration has been linked to conditions such as Alzheimer’s disease and Huntington’s disease, highlighting their relevance to neurodegeneration and age-related methylation changes.
Explain Tissue-Specific DNAm Age Variation
Different tissues age at different epigenetic rates—a phenomenon with important implications for understanding organ systems decline.
Brain tissue shows substantial regional heterogeneity:
- Frontal cortex ages at roughly average rates compared to other tissues
- Hippocampus shows moderate acceleration in some studies
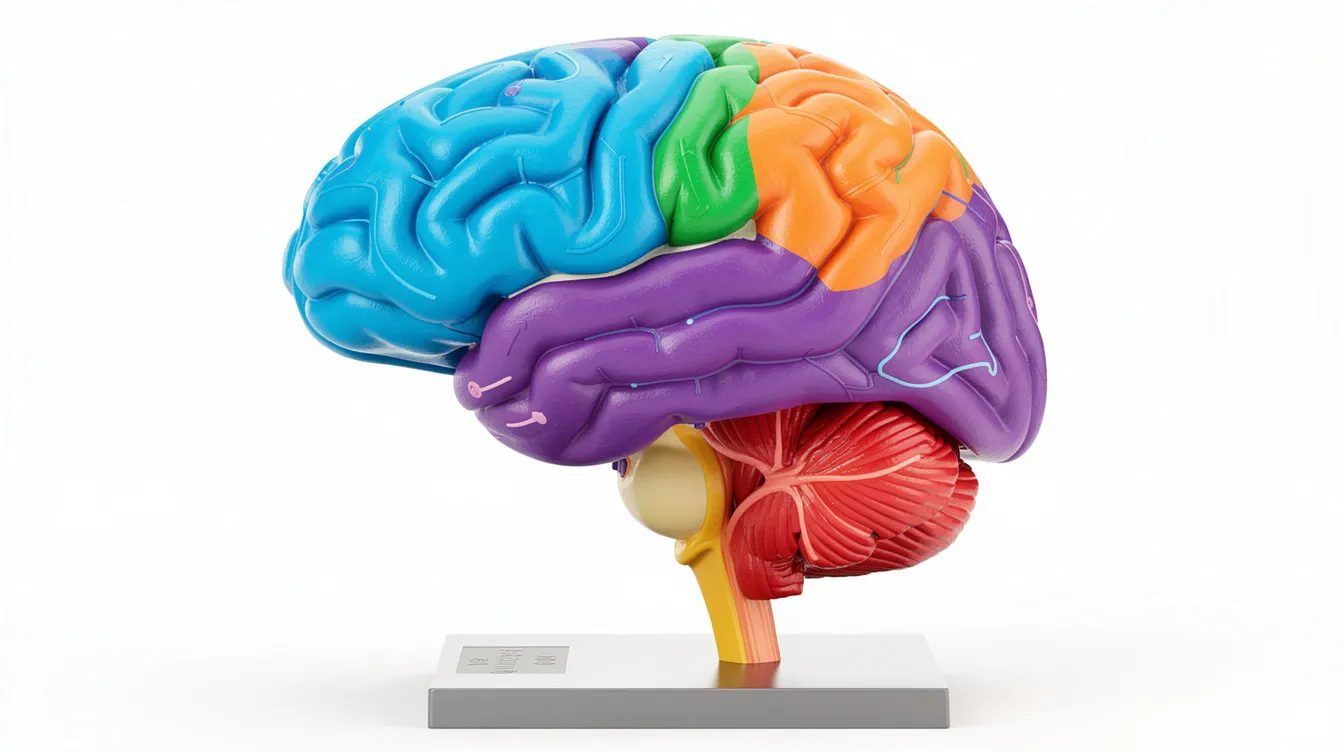
- Cerebellum consistently ages slower than other brain regions
- White matter versus gray matter differences exist but are less characterized
This variation likely reflects differences in:
- Cell turnover rates (higher turnover = faster clock ticking)
- Proliferative history of resident cells
- Local metabolic demands
- Neurogenesis rates in specific regions
For researchers analyzing different tissues, pan-tissue clocks provide comparability across sample types, though tissue-specific clocks may offer superior accuracy for single-tissue studies.
Note Observation That Cerebellum Ages Slowly
The cerebellum ages slowly compared to other brain regions—a consistent finding across multiple clock studies and populations.
Horvath’s original clock rates the cerebellum at approximately 0.7x the aging rate of other tissues. This means a 70-year-old’s cerebellum might show a DNAm age closer to 49 years on a pan-tissue scale.
Proposed explanations include:
- Lower cell turnover in cerebellar Purkinje neurons
- Limited adult neurogenesis compared to hippocampus
- Distinct developmental methylation programs
- Protective metabolic characteristics
The practical implication: when analyzing brain tissue, researchers should either use cerebellum-specific calibrations or account for this systematic offset when comparing across brain regions.
Connect DNAm Age To Cognitive Functioning Decline
Epigenetic age acceleration in brain tissue correlates with cognitive functioning measures, with acceleration predicting decline.
Key findings from epidemiological studies:
- Correlation of approximately r = -0.3 between DNAm age and MMSE scores
- Accelerated brain DNAm age predicts dementia onset 2-7 years before clinical diagnosis
- Associations persist after controlling for education and other cognitive reserve factors
- Blood-based epigenetic clocks partially capture brain aging, enabling non-invasive assessment
The cognitive functioning connection suggests that epigenetic clock analysis may eventually support clinical risk stratification for cognitive decline, though current evidence remains observational.
Discuss Associations With Alzheimer’s Disease Risk
Alzheimer’s disease shows consistent associations with accelerated brain epigenetic aging across multiple studies and clock variants.
Evidence Summary:
| Finding | Magnitude | Source |
|---|---|---|
| Cortical acceleration in AD | 2.5-6 years | Horvath 2015, others |
| Blood acceleration pre-diagnosis | 1-3 years | Prospective cohorts |
| Correlation with Braak stage | Positive | Neuropathology studies |
| Heritability of brain acceleration | h² = 0.2 | Twin studies |
Mechanistically, accelerated aging in Alzheimer’s disease associates with:
- Hypermethylation at APP and MAPT loci (genes central to amyloid and tau pathology)
- Hypomethylation at immune-related genes
- Inflammatory pathway activation
Similar patterns emerge for Huntington’s disease, suggesting neurodegenerative conditions broadly associate with epigenetic aging dysregulation.
Whether acceleration causes or results from disease pathology remains unclear. Reverse causation is plausible—disease processes themselves may alter methylation landscapes. Mendelian randomization studies provide mixed evidence for causal directions.
Tissue Notes: Cerebellum Ages
When working with brain tissue samples, special attention to cerebellar data improves interpretation accuracy.
Recommend Including Cerebellum-Specific Data When Available
Studies with access to multiple brain regions should:
- Report cerebellum ages separately from cortical measures
- Apply cerebellum-specific clock calibrations when available (Horvath developed sub-clocks for this purpose)
- Note sample sizes for each region independently
- Consider whether pooling regions obscures meaningful regional variation
The cerebellum’s distinct aging trajectory means pooling it with other brain regions can artificially lower average brain DNAm age estimates and reduce sensitivity to detect acceleration in faster-aging regions.
Advise Comparing Cerebellum Results To Other Brain Regions
Direct comparisons reveal important patterns:
- Up to 10-year discrepancies exist between cerebellum and cortex in the same individuals
- Regional differences may vary by disease state
- Comparing regions within individuals controls for confounders affecting whole-brain estimates
Researchers analyzing brain tissue should consider reporting regional acceleration metrics—the difference between a region’s DNAm age and that individual’s average across all sampled regions. This approach captures aging heterogeneity within organ systems.
Disease Associations: Chronic Diseases, Cancer Risk, And Breast Cancer
Epigenetic age acceleration links to numerous disease outcomes, though the nature of these associations requires careful interpretation.
Summarize Links Between DNAm Age And Chronic Diseases
Accelerated clocks predict major chronic diseases in prospective studies:
| Condition | Hazard Ratio per Year Acceleration | Notes |
|---|---|---|
| All-cause mortality | HR 1.12 per SD | Meta-analysis |
| Cardiovascular events | HR 1.04-1.40 | Multiple cohorts |
| Type 2 diabetes | HR 1.15 | Prospective studies |
| Chronic kidney disease | Elevated | Renal transplant data |
| Frailty | Strongly associated | Aging cohorts |
These associations generally persist after adjusting for traditional risk factors, suggesting epigenetic clocks capture aging information beyond conventional assessments.
Down syndrome represents an instructive example: individuals with trisomy 21 show accelerated epigenetic aging from early life, consistent with their increased rates of aging-related conditions.
Outline Evidence Connecting DNAm Age To Cancer Risk
The relationship between epigenetic clocks and cancer risk is complex, with seemingly contradictory findings across cancer types and clock variants.
Pre-cancerous and Normal Tissue:
- EpiTOC clock (measuring mitotic divisions via Polycomb target methylation) accelerates in pre-cancerous lesions
- Normal tissue adjacent to tumors often shows acceleration
- Some evidence suggests acceleration predates clinical cancer diagnosis
Tumor Tissue:
- Many tumors show paradoxical age deceleration
- Proliferative reset may rejuvenate methylation patterns
- Heterogeneity exists across cancer types
The dual directionality makes cancer associations challenging to interpret. Second generation clocks trained specifically on mortality outcomes (GrimAge, PhenoAge) may capture cancer risk more consistently than chronological age-trained clocks.
Detail Breast Cancer Association Studies To Reference
Breast cancer has received particular attention in epigenetic clock research, with data from large cohorts providing relatively robust estimates.
Key studies from the Women’s Health Initiative and UK Biobank show:
- Intrinsic epigenetic age acceleration (IEAA) elevates breast cancer risk by 10-20% per standard deviation
- Pre-diagnostic blood samples from women who later developed breast cancer show 1-3 years acceleration
- Associations appear stronger for certain molecular subtypes
- Both blood-based and tissue-based measures show relevant associations
These findings suggest epigenetic clocks might eventually contribute to cancer risk stratification, though current evidence doesn’t support clinical implementation.
Caution About Inferring Causality From Associations
Association does not equal causation—a critical caveat for interpreting epigenetic clock findings.
Potential confounding factors:
- Shared causes may drive both acceleration and disease (e.g., chronic inflammation)
- Preclinical disease may alter methylation (reverse causation)
- Cell types contributing to blood samples shift with health status
- T cells and other immune populations vary with disease states
Mendelian randomization studies—using genetic variants as instruments—provide some causal evidence but show bidirectional effects in some cases. The field has not definitively established whether accelerated clocks cause disease, result from disease, or reflect shared underlying processes.
Until causal mechanisms are clarified, epigenetic clocks should be interpreted as biomarkers rather than therapeutic targets.
Interventions, Clinical Applications, And Age Acceleration
Despite causality questions, epigenetic clocks serve valuable roles in testing interventions and potentially guiding clinical decisions.
Describe Using Clocks To Test Anti-Aging Interventions
Epigenetic clocks provide proof-of-concept endpoints for longevity interventions:
Animal Studies: | Intervention | Effect | Model | |————–|——–|——-| | Caloric restriction | 0.2-0.5 years equivalent deceleration | Mice | | Parabiosis (young blood) | 1-2 years rejuvenation | Mice | | Epigenetic reprogramming (Yamanaka factors) | Partial reversal | Mice, cellular |
Human Studies: | Intervention | Effect | Trial Type | |————–|——–|————| | Metformin | 0.4 years slowing | Clinical trials | | Diet/exercise | 0.5-3 years deceleration | Lifestyle RCTs | | Senolytics | Under investigation | Early trials |
These findings demonstrate that DNAm age responds to interventions—a prerequisite for using clocks as surrogate endpoints in anti-aging research.
Propose Clinical Research Use Cases For DNAm Age
Beyond intervention testing, epigenetic clock analysis offers several research and potential clinical applications:
- Trial endpoint: Surrogate measure for longevity in shorter-term studies
- Patient stratification: Identifying individuals with accelerated aging for targeted interventions
- Treatment monitoring: Tracking iatrogenic aging from chemotherapy or other medical treatments
- Transplant medicine: Predicting rejection risk based on donor/recipient epigenetic age mismatch
- Drug development: Biomarker for FDA-qualified aging measures
Current evidence supports research applications more strongly than routine clinical use. Science advances more rapidly than clinical translation in this field.
Explain How To Calculate Age Acceleration Residuals
Computing age acceleration requires regression-based adjustment:
Standard Approach:
- Fit linear model: DNAm Age ~ Chronological Age
- Extract residuals (observed minus predicted DNAm age)
- Positive residuals indicate acceleration; negative indicate deceleration
Cell-Type Adjusted (Intrinsic) Acceleration:
- Estimate cell type proportions (e.g., using EpiDISH algorithm)
- Fit model: DNAm Age ~ Chronological Age + Cell Proportions
- Extract residuals
Extrinsic Acceleration:
- Includes immune cell changes rather than adjusting for them
- Captures additional aging-relevant information about immune system state
Horvath’s online calculator and other freely available tools accept normalized beta-value inputs and return both DNAm age and acceleration metrics.
Evaluating Clock Performance
Rigorous clock evaluation requires multiple accuracy metrics and appropriate validation strategies.
List Accuracy Metrics To Report
Every epigenetic clock publication should report:
| Metric | Expected Range | Interpretation |
|---|---|---|
| Pearson r | 0.90-0.98 | Correlation strength |
| MAE | 2.9-4.0 years | Average prediction error |
| RMSE | Slightly higher than MAE | Penalizes large errors |
| Bias | Note direction | Systematic over/under-estimation |
| R² | 0.81-0.96 | Variance explained |
Performance varies by tissue. Blood typically achieves MAE around 1.9-2.5 years; brain tissue around 3.2 years; cerebellum around 4.1 years for Horvath’s pan-tissue clock.
Recommend Cross-Validation Strategies To Use
Robust validation prevents overfitting:
- K-fold cross-validation (k=10): Standard approach, stratified by age and sex
- Leave-one-out: Maximum data usage, computationally intensive
- External validation: Test on independent cohorts not used in training
- Tissue stratification: Evaluate separately by sample type
Sample sizes matter. Report confidence intervals around all performance metrics. For example: “r = 0.96 (95% CI: 0.95-0.97), n = 10,000.”
Advise Reporting Tissue-Specific Performance Tables
Different tissues require separate evaluation. Template for reporting:
| Tissue | n | MAE (years) | r | 95% CI |
|---|---|---|---|---|
| Whole blood | 5,000 | 2.1 | 0.97 | 0.96-0.98 |
| Saliva | 800 | 2.8 | 0.94 | 0.92-0.95 |
| Buccal | 500 | 3.2 | 0.92 | 0.89-0.94 |
| Brain cortex | 200 | 3.5 | 0.90 | 0.86-0.93 |
This transparency helps readers assess applicability to their specific research context.
Reporting And Visualization Best Practices
Clear communication of epigenetic clock results requires standardized reporting and effective visualizations.
Provide Template For CpG Coefficient Table
For clock transparency, publish coefficient tables:
| CpG ID | Coefficient | Gene | Chromosome | Direction |
|---|---|---|---|---|
| cg24724428 | +15.2 | FHL2 | 2 | Hypermethylation |
| cg16867657 | -8.7 | ELOVL2 | 6 | Hypomethylation |
| cg00000029 | +4.3 | NPTX2 | 7 | Hypermethylation |
This enables replication and mechanistic investigation of clock components.
Suggest Scatter Plots Of DNAm Age Versus Chronological Age
The canonical visualization plots predicted versus true age:
- X-axis: Chronological age
- Y-axis: DNAm age
- Diagonal reference line (perfect prediction)
- Points colored by acceleration magnitude
- Annotation: R², MAE, n, confidence intervals
Residual plots showing acceleration versus chronological age help identify systematic biases (e.g., underestimation in elderly).
Require Inclusion Of Sample Sizes And Confidence Intervals
Every reported association should include:
- Sample size (n)
- Effect size (β, HR, or r)
- 95% confidence interval
- P-value or false discovery rate
- Normalization method used (e.g., BMIQ, quantile)
Studies by Horvath h et al, Hannum g et al, Lu l et al, and others have established reporting norms. Authors like Chen k et al, Morgan j et al, and similar researchers have contributed to standardization efforts. Following these conventions enables meaningful cross-study comparisons.
Limitations, Controversies, And Open Questions
Epigenetic clocks face important limitations that temper enthusiasm about their current applications.
List Measurement Confounders To Control
Several factors can bias clock estimates:
Cell Composition: Blood-based clocks are sensitive to shifts in cell types. An infection increasing T cells proportion could alter DNAm age independent of actual aging. Deconvolution algorithms estimate cell proportions for adjustment, but imperfectly.
Technical Factors:
- Batch effects between array processing dates
- Probe reliability varies across CpG sites
- DNA quality and bisulfite conversion efficiency
- Platform differences (450K vs EPIC)
Population Bias: Clocks trained predominantly on European ancestry samples show increased MAE (+1 year or more) when applied to African or Asian populations. Ethnicity-specific calibration may be necessary.
Tissue Mismatch: Applying blood clocks to saliva or other biomarkers introduces error. Brain clocks fail when applied to peripheral tissues.
Discuss Causality Versus Association Debate
The epigenetic clock theory of aging proposes that methylation changes drive aging phenotypes. Alternative views suggest clocks merely reflect other aging processes.
Programmed Aging View:
- Methylation changes extend developmental programs
- Clock reflects biological “programming” for finite lifespan
- Interventions might reprogram the clock
Entropic/Stochastic View:
- Methylation drift reflects accumulated molecular damage
- Stochastic variation and TET/DNMT imbalances cause changes
- Clock is a passive readout, not a causal driver
Current evidence doesn’t definitively resolve this debate. The truth likely involves elements of both: some methylation changes may be programmed while others reflect stochastic decay.
Identify Gaps In Multi-Tissue And Cross-Species Generalizability
Significant knowledge gaps remain:
- Multi-tissue performance: Clocks optimized for one tissue perform poorly in others
- Cross-species limits: Pan-mammalian clocks work well in mammals but haven’t been validated beyond
- Reversibility bounds: Yamanaka factors fully reset clocks in vitro, but partial in vivo reset carries tumorigenesis risk
- Drift mechanisms: Molecular causes of clock progression remain incompletely characterized
These gaps represent opportunities for future research rather than fatal flaws in the clock concept.
Future Directions: Pan-Mammalian Clocks, Multi-Omic, And Translation
The field continues advancing rapidly, with several promising directions for the coming decade.
Highlight Pan-Mammalian Clock Research Priorities
Pan-mammalian clocks—like Horvath’s 2022 universal clock spanning 59 mammalian species—enable comparative aging biology. Research priorities include:
- Expanding to non-mammalian vertebrates and invertebrates
- Identifying conserved versus species-specific aging CpGs
- Testing whether maximum lifespan correlates with clock characteristics
- Using short-lived species (mice, naked mole rats) as intervention testbeds
These cross-species approaches may reveal fundamental aging mechanisms conserved across evolutionary time.

Propose Integrating Multi-Omic Aging Markers
Epigenetic clocks represent one omics layer. Integration with other biomarkers promises improved prediction:
- Proteomics: Circulating protein patterns complement methylation
- Metabolomics: Metabolite profiles capture metabolic aging
- Transcriptomics: Gene expression data reveals functional consequences
- Other biomarkers: Telomere length, senescence markers, inflammatory proteins
Deep learning models integrating multi-omic data have achieved correlations approaching r = 0.99 with age, though added clinical value beyond methylation alone remains to be demonstrated.
Recommend Longitudinal Intervention Trials For Validation
Definitive evidence that clock deceleration improves healthspan requires randomized controlled trials with sufficient follow-up:
- TAME Trial: Testing metformin using epigenetic clocks as secondary endpoints
- Senolytics trials: Monitoring epigenetic effects of senescent cell clearance
- Lifestyle intervention RCTs: Longer-term follow-up for clinical outcomes
- NAD+ precursor studies: Tracking methylation alongside metabolic outcomes
These trials will determine whether accelerated clocks can be meaningfully slowed and whether doing so produces health benefits.
Suggest Steps Toward Standardization And Clinical Translation
Moving epigenetic clocks toward clinical utility requires:
- Standardized probe sets: Common CpG panels across clocks for comparability
- Shared preprocessing pipelines: Reduce technical variation between laboratories
- Reference datasets: Well-characterized cohorts for benchmarking
- FDA engagement: Qualification pathways for aging biomarkers
- Clinical cut-points: Define actionable thresholds for intervention
Professional societies and funding agencies are beginning to address standardization. Clinical translation remains years away but progresses steadily.
Key Takeaways
- Epigenetic clocks estimate biological age by analyzing dna methylation patterns across specific CpG sites
- DNAm age differs from chronological age and better predict mortality risk and health outcomes
- Age acceleration (positive or negative) captures individual variation in biological aging rates
- The cerebellum ages slowly compared to other brain regions, requiring separate analysis
- Lifestyle factors including diet, exercise, smoking, and BMI associate with epigenetic aging rates
- Disease associations exist for cardiovascular conditions, cancer, and neurodegeneration, but causality remains unproven
- Clocks serve as valuable research endpoints for testing anti-aging interventions
- Future directions include pan-mammalian clocks, multi-omic integration, and clinical translation
Conclusion
Epigenetic clocks have transformed how researchers quantify biological aging, moving beyond calendar years to capture molecular signatures of time. By measuring dna methylation levels across the genome, these tools reveal that individuals age at different rates—and that lifestyle factors, diseases, and interventions can influence this trajectory.
The practical implications continue emerging. Understanding your epigenetic age may eventually become as routine as checking cholesterol or blood pressure. For now, the strongest evidence supports research applications: testing interventions, stratifying clinical trial participants, and investigating aging mechanisms across the aging cell and normal tissue.
As longitudinal trials validate whether slowing epigenetic clocks translates to extended healthspan, and as standardization efforts enable cross-study comparisons, these tools will become increasingly central to personalized medicine and longevity science.
The journey from laboratory curiosity to clinical utility takes time. But epigenetic clocks represent one of the most promising aging biomarkers discovered in the past decade—and their story is far from over.